Ad Spend Intelligence Platform
Media-expenditure analytics across TV, radio, web, outdoor, press and magazines
My role: Full-stack developer: NestJS API, MySQL data model, React reporting dashboard, deployment.
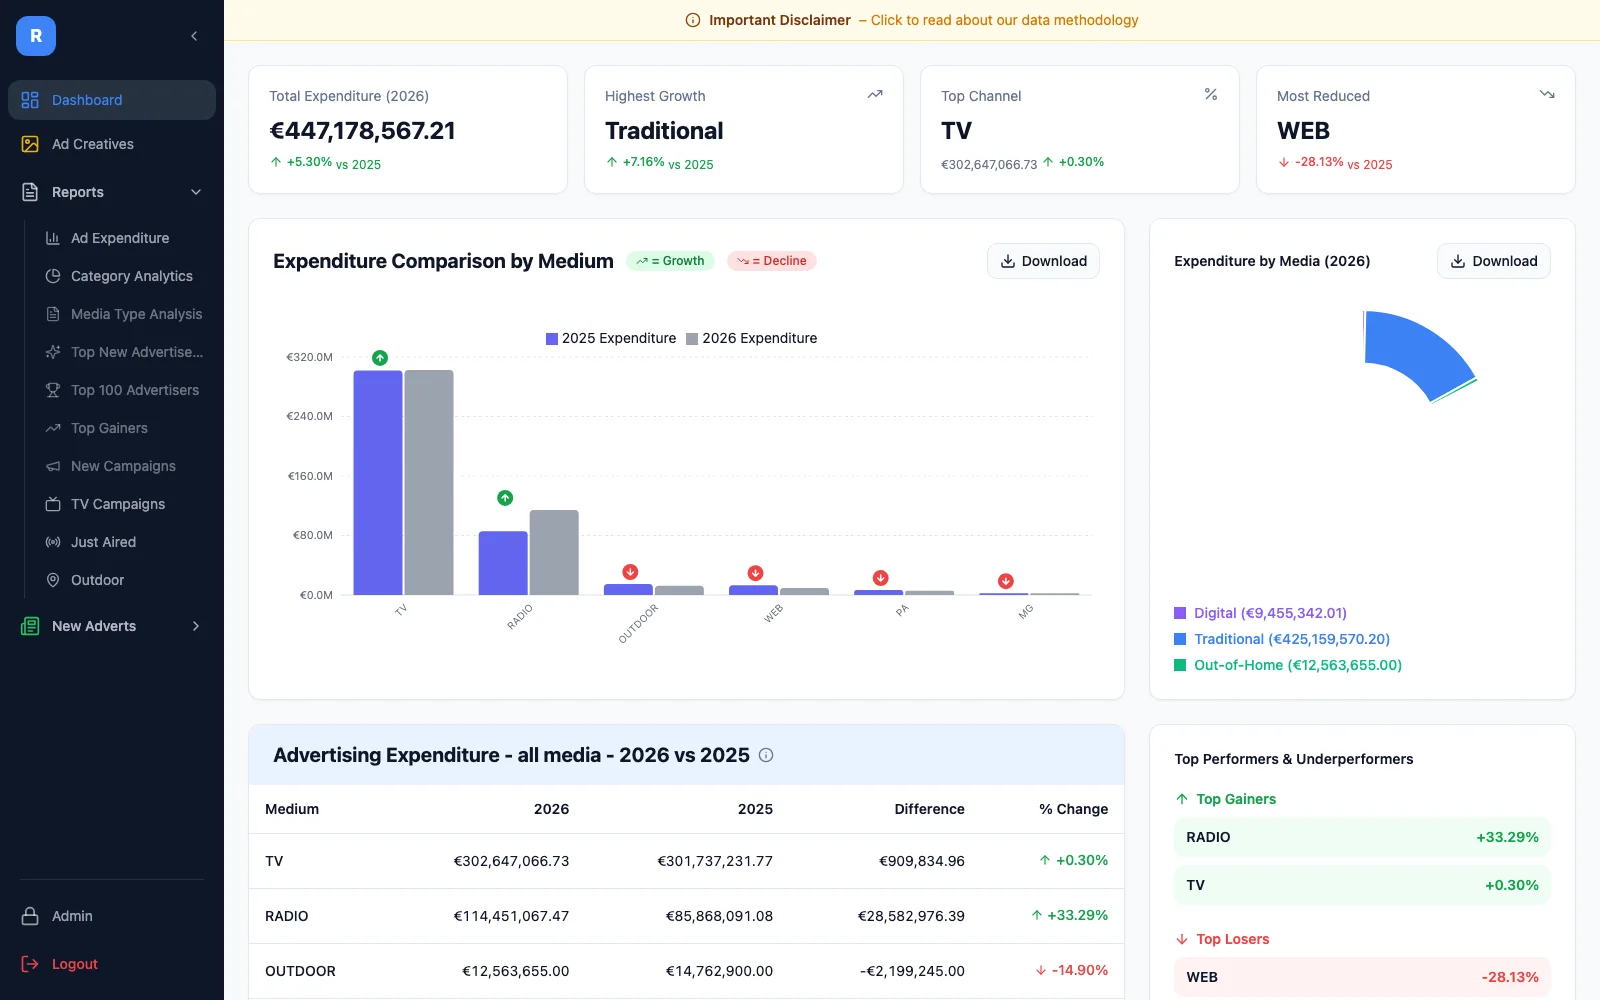
In production for a media-monitoring company in Cyprus. Client name shown only with their agreement. Screenshots were taken with the client's permission and show aggregate market figures.
Overview
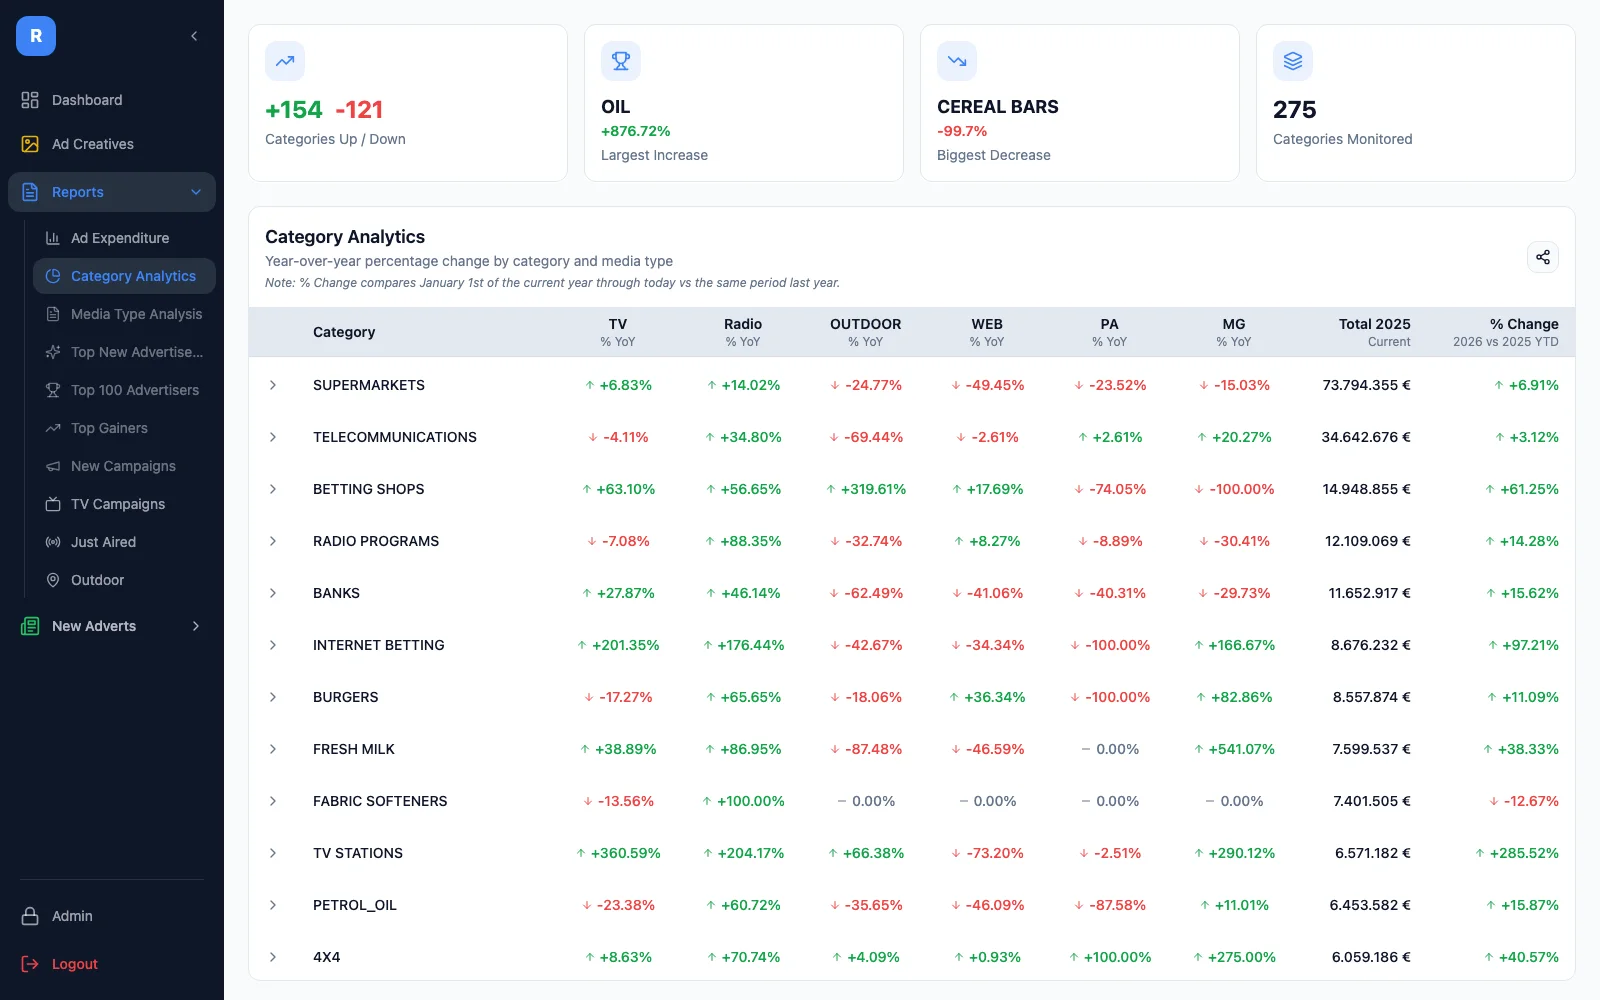
An analytics product for a media-monitoring company. It turns the company's advertisement monitoring data into reports agencies pay for: top advertisers, new campaigns, gainers, category and media-type analysis, just-aired TV spots with creatives, and public share links for individual reports.
The problem
The company had rich monitoring data but delivered it as spreadsheets. Analysts rebuilt the same reports by hand every month and could not give clients self-serve access.
The solution
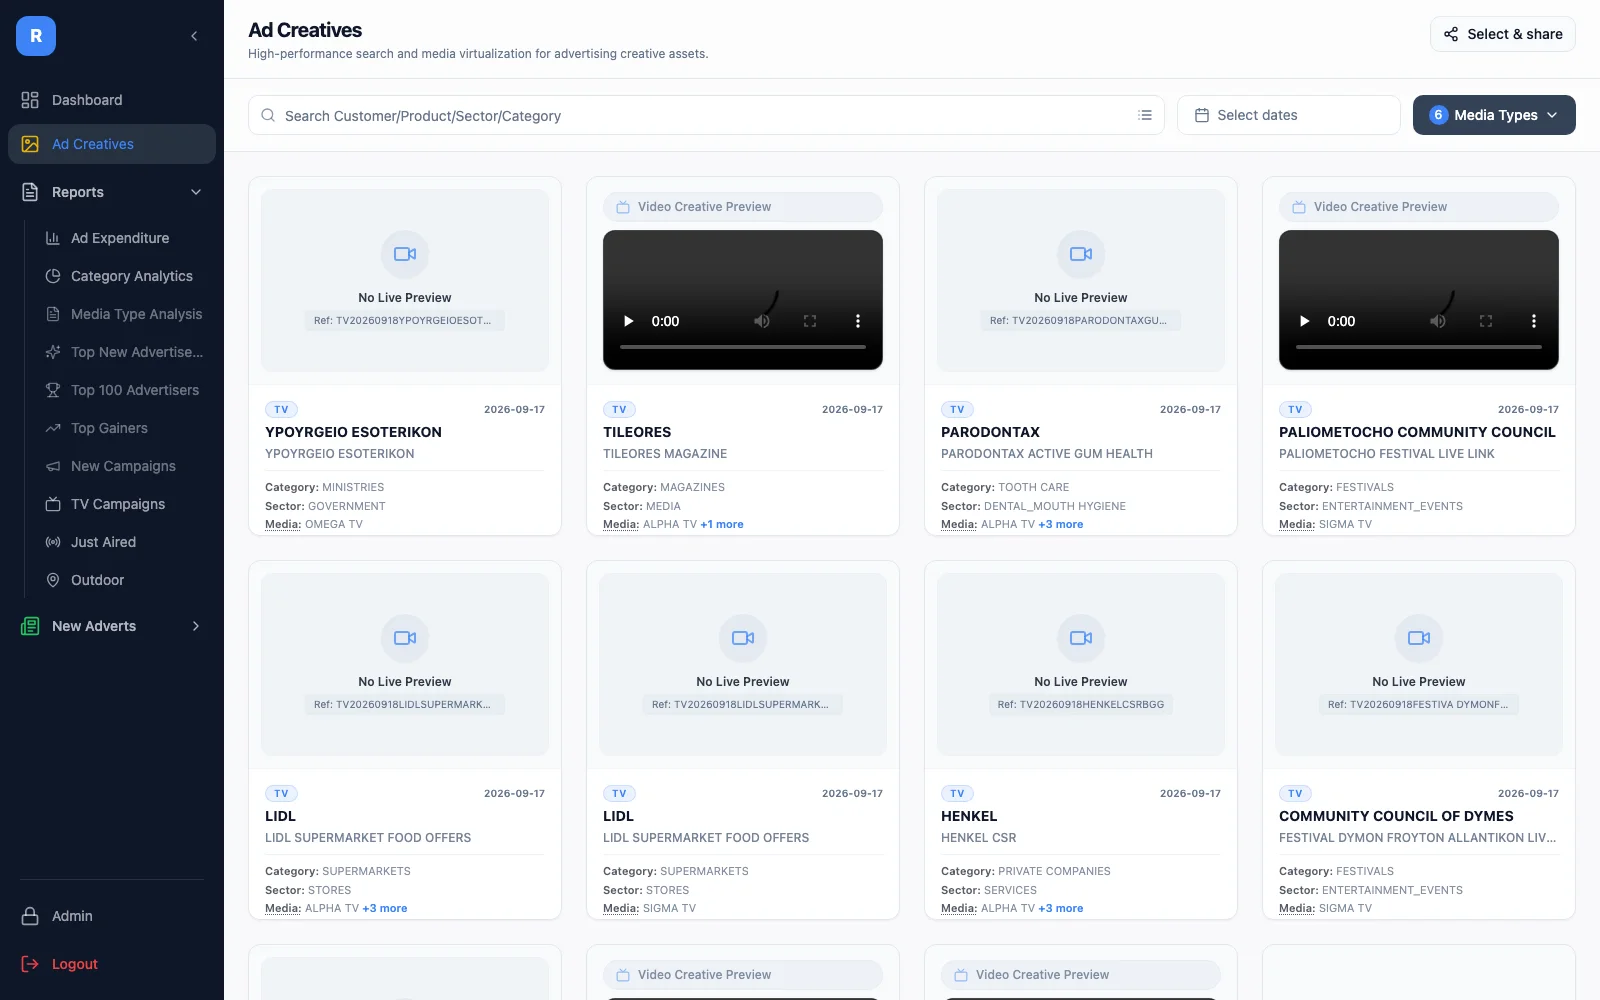
A NestJS 10 API with JWT and refresh tokens, Swagger documentation, rate limiting and structured logging sits on the MySQL warehouse. A React dashboard offers dashboard summaries, searchable advertiser reports by month and year, category analytics, TV campaign and just-aired views, ad-creative galleries, and shareable public reports.
Principal features
Report library
Top 100 advertisers, top new advertisers, top gainers, new campaigns, TV campaigns, media-type and category analysis.
Ad creatives
Browse and share the actual creatives behind the spend, with a media proxy for images.
Public share links
Any report or creative set can be shared with a client through an unguessable key, no login required.
Fast tables
Virtualised tables keep tens of thousands of rows smooth; Excel export for the rest.
Caching
Expensive TV-campaign queries use stale-while-revalidate caching with a hard TTL.
Role-based access
Admin and analyst roles with user management.
Technical decisions
- Read-heavy endpoints are cached at the API layer, so the warehouse is queried once per window instead of once per user.
- Charts and tables share one query layer (TanStack Query) so filters stay consistent across every report.
- Playwright and Vitest are wired into the frontend so the reporting flows can be covered as they stabilise.
Screens
More Web Applications
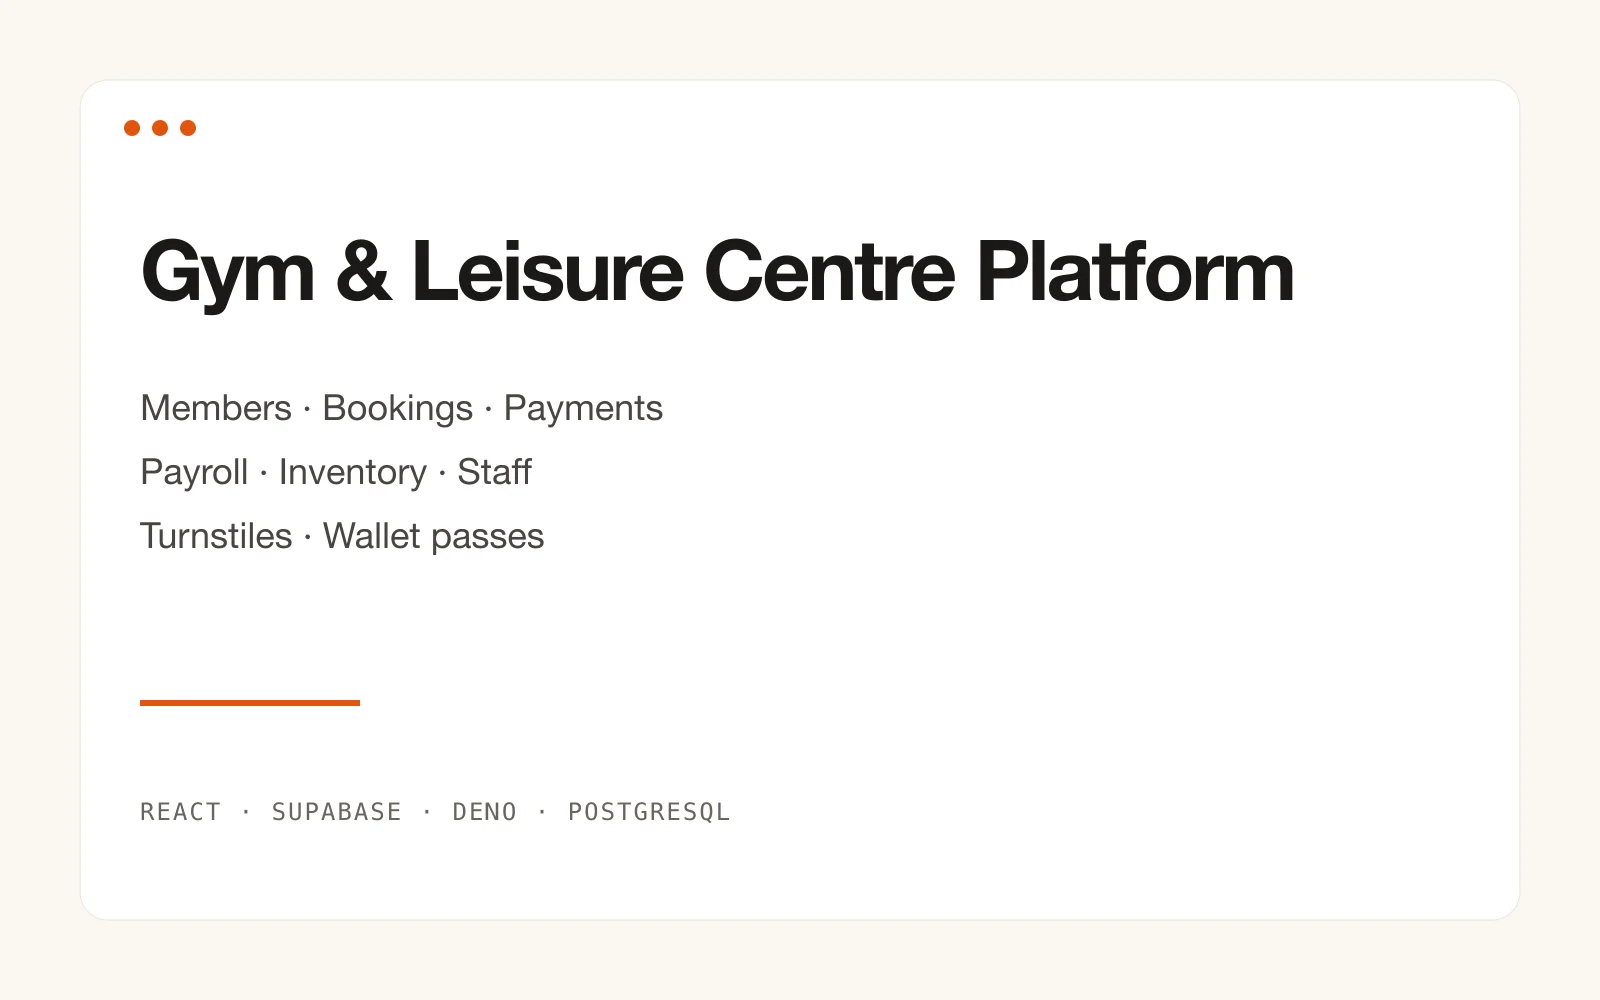
Gym & Leisure Centre Platform
Members, bookings, payments, payroll and turnstiles for a live club in Cyprus
View project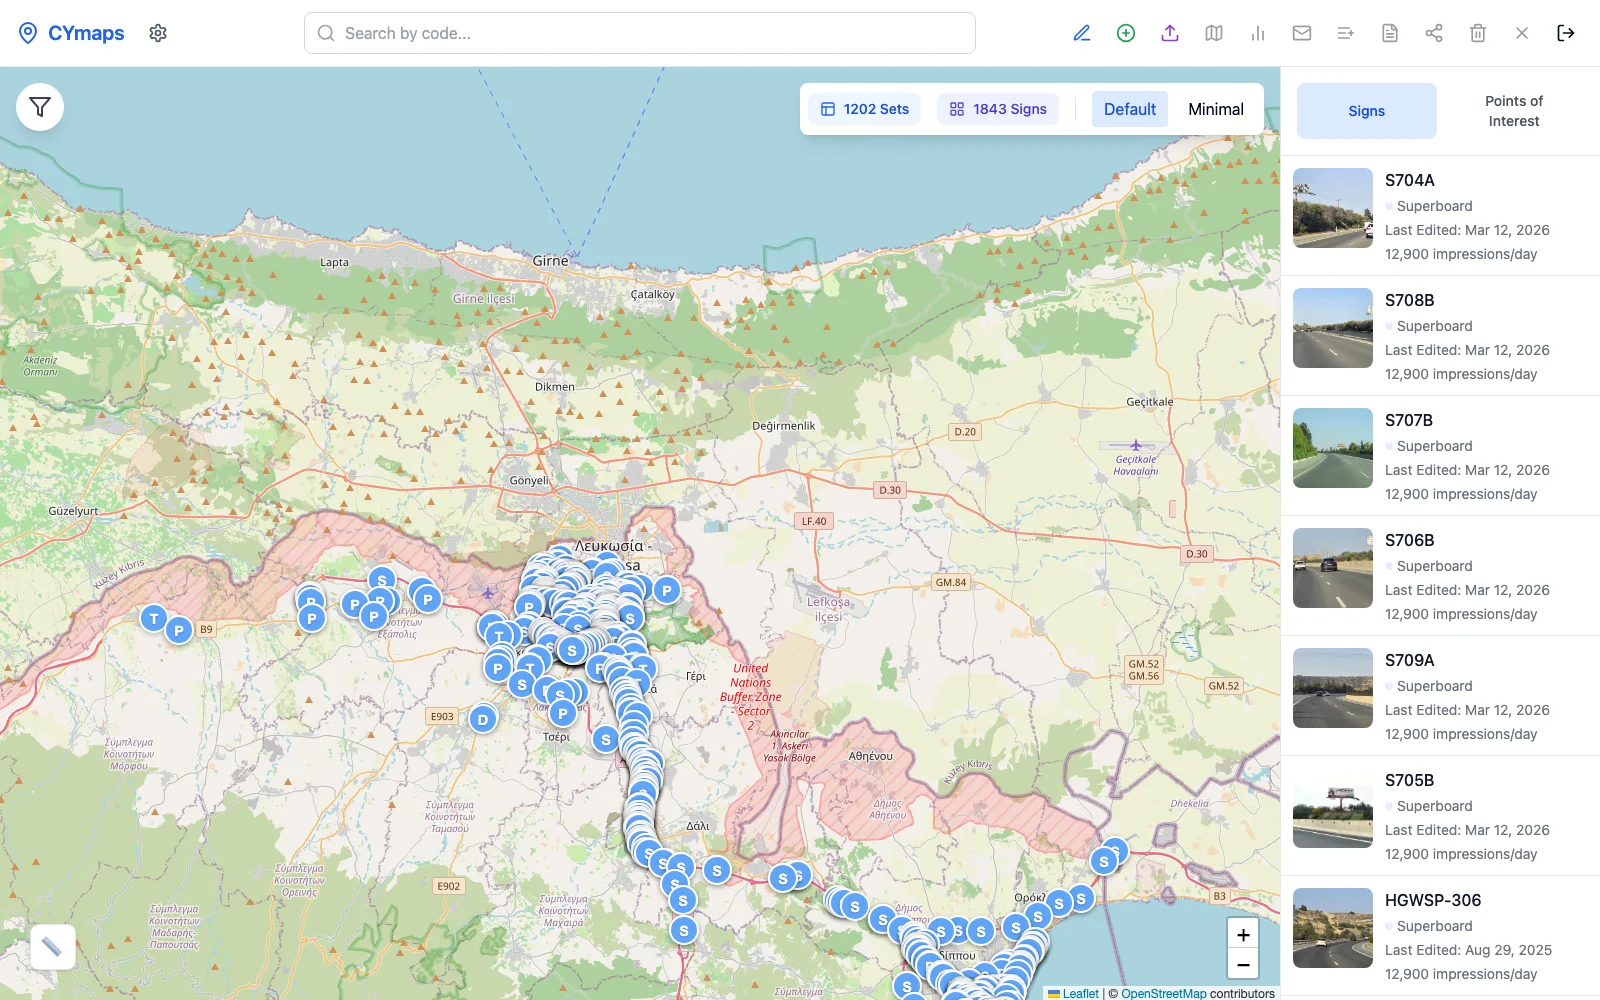
CYMaps
Billboard inventory, availability and campaign booking on a map, for Cyprus
View project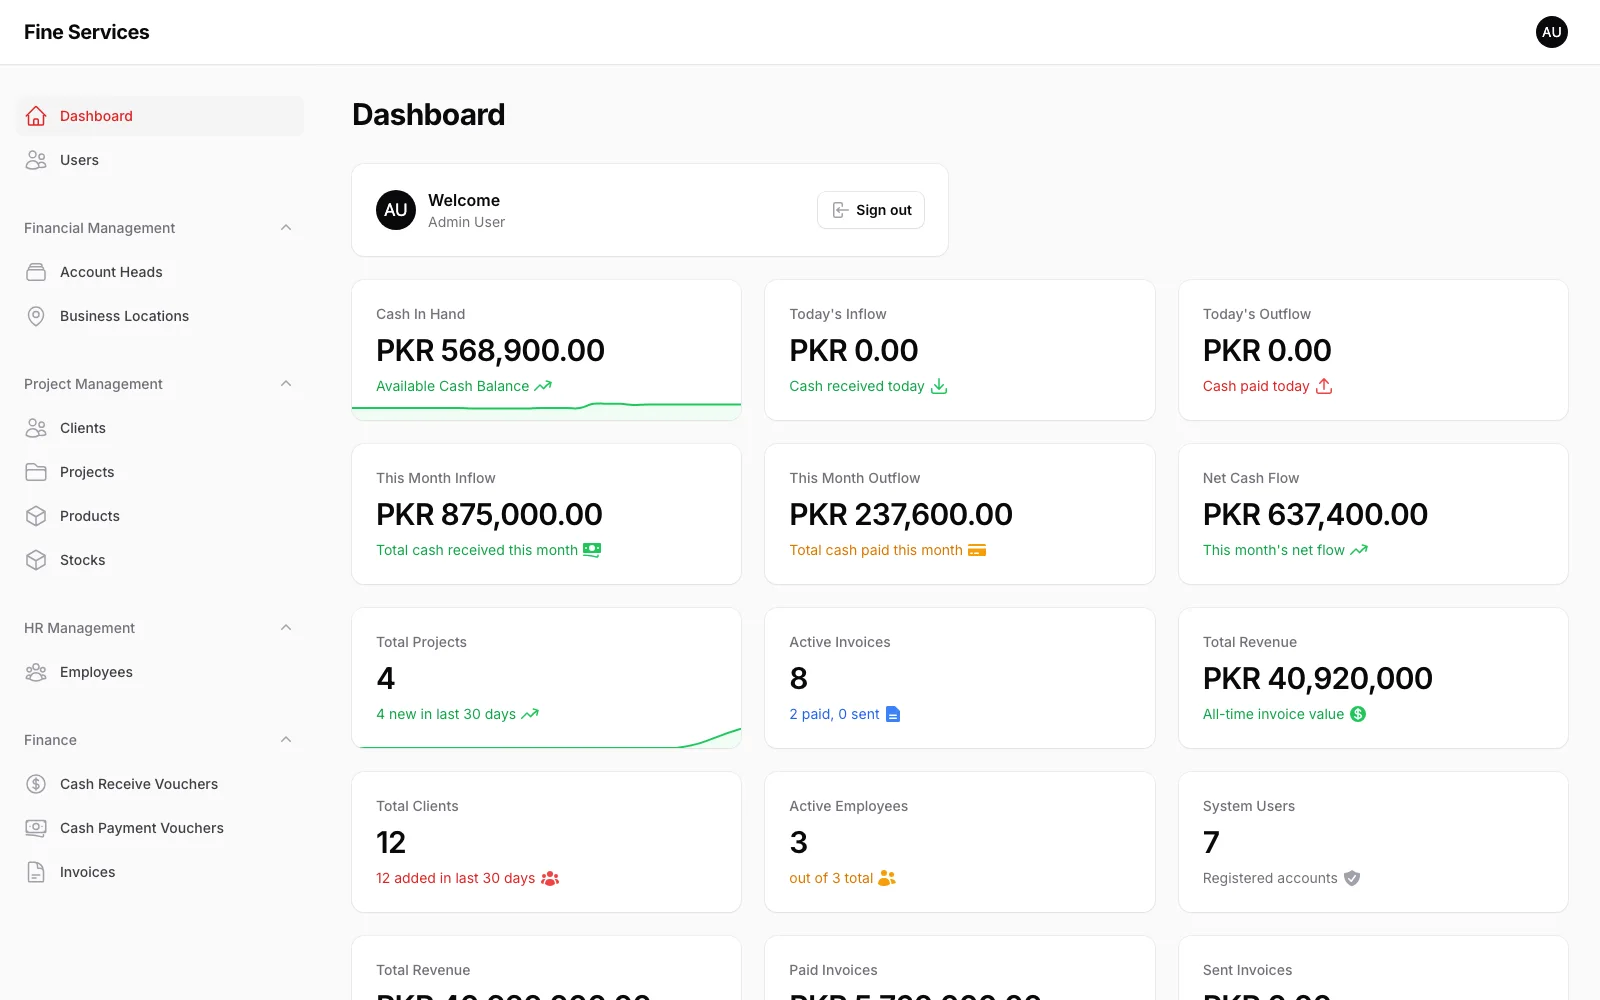
Fine Service Management
An ERP for a services company: accounting, projects, inventory, people
View project